Visual Representation of Architecture - Mermaid Diagrams
Visual representation of Architecture through Mermaid diagrams


We humans are better at learning and understanding things visually. It isn't easy for us to share our imagination through words.
The same applies to software architecture as well. When we’re designing a solution, having visual tools to aid our imagination helps. These visual tools also allow us to convey the architecture to the other stakeholders as well. This ensures that there is no gap in understanding and a correct solution is being built.
Mermaid
One of the tools that I frequently use for creating diagrams is Mermaid diagrams.
Mermaid diagrams are code-based diagrams that represent structures and processes, generated using Markdown-inspired text definitions that are easy to write and modify.
These diagrams are pretty standard and are widely supported by a lot of tools like Notion, Obsidian, GitHub, etc.
Note - Notion has a pretty neat mermaid diagram support in which a split view is also available. Just add a code block using /code and select mermaid from the dropdown.

Visual Editor -
To create a diagram as code you need to have a pretty simple place to write, update, and visually see the diagram. The live editor provides just the required stuff.
A split-screen view with an example for starting is what one needs when creating a diagram.
ChatGPT/AI Support
These diagrams can be understood by AI tools like ChatGPT. So you can treat the AI as your assistant and ask for help in designing the solution or ask for potential problems.
Example - asking for help in understanding the diagram.
We can also get the diagram generated through the AI itself. This is pretty helpful especially when you’re stuck with analysis paralysis or can provide a decent starting point to gather your thoughts.
Example - generating a login flow sequence diagram.
Types of diagrams
Although Mermaid supports many types of diagrams, I’ll try to cover the ones that I’ve used mostly:
Sequence diagram
Flowchart
Class diagram
ER diagrams
State diagrams
The above diagrams are usually enough to represent the solution in fair detail.
Sequence Diagram
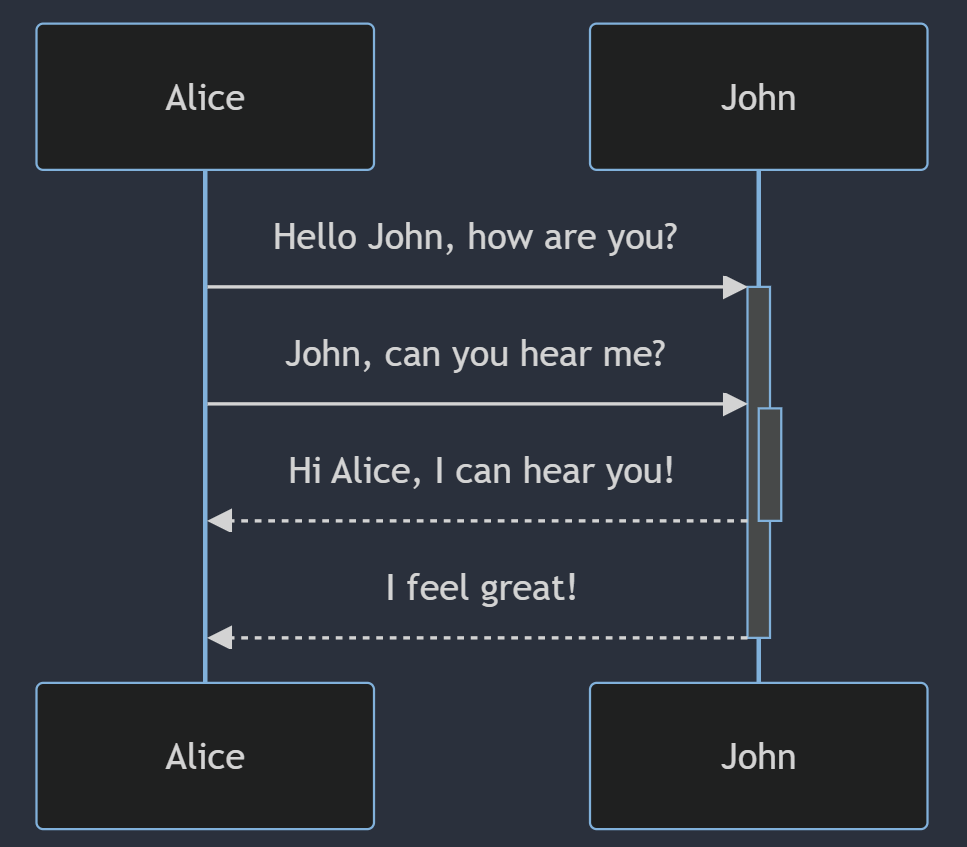
A Sequence diagram is an interaction diagram that shows how processes operate with one another and in what order.
Pretty simple and straightforward to create a sequence diagram
sequenceDiagram
    Alice->>+John: Hello John, how are you?
    Alice->>+John: John, can you hear me?
    John-->>-Alice: Hi Alice, I can hear you!
    John-->>-Alice: I feel great!
yields -
Flowchart
A flowchart is a type of diagram that represents a workflow or process. A flowchart can also be defined as a diagrammatic representation of an algorithm, a step-by-step approach to solving a task.
Flowcharts are immensely helpful in noting down and defining processes and flows especially while designing microservices or while defining user flows.
flowchart TD
    A[Christmas] -->|Get money| B(Go shopping)
    B --> C{Let me think}
    C -->|One| D[Laptop]
    C -->|Two| E[iPhone]
    C -->|Three| F[fa:fa-car Car]
yields,

Class Diagram
It is a type of static structure diagram that describes the structure of a system by showing the system's classes, their attributes, operations, and the relationships among objects
Once you’ve defined the processes and the flows using sequence diagrams and flowcharts, probably the next thing that you need to do is to define the data entities in the system and their schema and methods.
For such cases, I feel like class diagrams work perfectly.
classDiagram
    Animal <|-- Duck
    Animal <|-- Fish
    Animal <|-- Zebra
    Animal : +int age
    Animal : +String gender
    Animal: +isMammal()
    Animal: +mate()
    class Duck{
      +String beakColor
      +swim()
      +quack()
    }
    class Fish{
      -int sizeInFeet
      -canEat()
    }
    class Zebra{
      +bool is_wild
      +run()
    }
yieds,

ER Diagrams
An entity–relationship model describes interrelated things of interest in a specific domain of knowledge.
In conjunction with the class diagrams, ER diagrams can be used to depict the relationship between the various entities in the system.
erDiagram
    CUSTOMER }|..|{ DELIVERY-ADDRESS : has
    CUSTOMER ||--o{ ORDER : places
    CUSTOMER ||--o{ INVOICE : "liable for"
    DELIVERY-ADDRESS ||--o{ ORDER : receives
    INVOICE ||--|{ ORDER : covers
    ORDER ||--|{ ORDER-ITEM : includes
    PRODUCT-CATEGORY ||--|{ PRODUCT : contains
    PRODUCT ||--o{ ORDER-ITEM : "ordered in"
yields,

State Diagram
A state diagram is used in computer science and related fields to describe the behavior of systems.
Although the official definition is somewhat different, but I’ve mostly used state diagrams to design DAGs for Airflow.
stateDiagram-v2
    [*] --> LoadData
    LoadData --> ParseData
    ParseData --> [*] : failure
    ParseData --> Compute
    ParseData --> PushKafka
    Compute --> [*]
yields,

Note:
Further documentation of the diagrams is available here. I would suggest going through the docs while creating any diagrams to ensure that the full capability of mermaid diagrams can be leveraged.
Have any thoughts or experiences to share? Drop a comment below – I’d love to hear from you!
Like it? Share it!
The ArchitectureTalks is a newsletter where I’ll be sharing tips and tricks to improve as a technical architect. Please subscribe to get notified of new releases.